Demostración de cómo mejorar la eficiencia operativa en el servicio general de patología de Uganda
mediante iniciativas regionales de fortalecimiento - Esquema piloto en la región de salud del Nilo Occidental
Ibrahimm Mugerwa1, Tony Boova2, Van Der Westhuizen2, Christopher Okiira1, Agnes Nakakawa3, Micheal Kasusse3, Suzan Nabadda1, Gaspard Guma1, Suleiman Ikoba1, Charles Kiyaga41Uganda National Health Laboratory Services, 2Beckman Coulter Life Sciences, 3Makerere University, 4ASLM
Mayor eficiencia para la gestión del inventario de los laboratorios
La evaluación inicial halló que habría un retraso en la entrega de suministros, con frecuentes desabastecimientos, debido a la deficiente comunicación, porque no existía una cadena de comando clara para coordinar esta actividad. Esto fue especialmente problemático para los suministros de carga vírica y para el diagnóstico precoz de recién nacidos (early infant diagnosis, EID). Se determinó que el pedido de suministros era errático, sin tener en cuenta los ciclos de distribución de las tiendas médicas nacionales (agencia de adquisiciones de Uganda). Además, no hubo herramientas ni mecanismos estandarizados para gestionar los niveles de existencias de productos básicos de laboratorio vitales, esenciales y necesarios (VEN).
Para resolverlo, CPHL trabajó con el nuevo coordinador de centros regionales con el fin de establecer un mecanismo coordinado de manera central para la distribución de los suministros de carga vírica y EID a través del sistema de centros. Esto llevó a un marcado aumento en el número de muestras referidas desde los centros a los CPHL. Además, se implementó un servicio de intercambio entre laboratorios para acumular existencias y otros productos básicos.
Se inició la formación en habilidades de gestión del tiempo para el personal regional a fin de que comprendiesen cómo coordinar el pedido con el sistema centralizado operado por las tiendas médicas nacionales. Hacia el final del estudio piloto, también se observaron mejoras en el transporte de suministros desde los almacenes centrales hasta los centros (mediante un servicio de mensajería gestionado centralmente por CPHL) y en su posterior distribución a instalaciones de nivel inferior.
Flujo de trabajo mejorado y tiempos de respuesta reducidos
El sistema de centros regionales de Uganda define el tiempo de entrega (TAT) de dos maneras:TAT1: Muestras de las instalaciones sanitarias de nivel inferior al centro, desde el momento en que se envía la muestra hasta la generación del resultado en el centro.
TAT2: muestras enviadas por el centro a los CPHL, el posterior retorno del resultado.
En los tres meses anteriores al inicio del estudio, TAT1 tenía una media de 2,7 semanas mientras que la TAT2 era de 4,3 semanas (ver los datos completos de TAT para los ocho centros en el Apéndice 4). Además, algunos resultados se extraviaron debido a la falta de una documentación y un sistema de seguimiento adecuados. Las mejoras fueron casi inmediatas y, al final del estudio piloto, TAT1 y TAT2 se redujeron a una semana o menos (Figura 3).
Figura 3: Reducciones significativas tanto de TAT1 como de TAT 2 durante el estudio piloto de 12 meses
Kiyaga C, Lee HH, Allain JP (2015) Adherence to Early Infant Diagnosis Testing Algorithm, a Challenge to Early Infant Diagnosis Program in Resource Limited Settings of Uganda. J HIV Clin Scientific Res 2(2): 030-039IMAGEN
Un objetivo específico era aumentar el acceso de los pacientes al diagnóstico esencial de VIH/SIDA y de infecciones oportunistas en la región de salud del Nilo Occidental. El bajo volumen de pruebas que se realizaron fue un factor importante en la falta de acceso de los pacientes.
En general, los volúmenes de muestras aumentaron en más del 350 % en el estudio piloto de 12 meses (Figura 4). Los hemogramas completos aumentaron un 5 % entre el primer y el segundo trimestre de la intervención.
Entre el segundo y el tercer trimestre del estudio piloto, el número de hemogramas completos aumentó en 585. La ligera caída (figura 5) en el tercer trimestre responde a los patrones de migración normales durante el tiempo festivo. Entre el primer y el cuarto trimestre, el volumen de muestras hematológicas procesadas en el centro aumentaron casi un 60 % (Figura 5). Acerca de mejoras en los volúmenes de CD4 y GenXpert, consulte la Figura 5a.
Figura 4: Aumento general del volumen de muestras
Figura 5: Aumento general de los volúmenes de muestra de los hemogramas completos
Figura 5a: Aumento general de los volúmenes de muestras, incluyendo CD4 y GenXpert
Antes de la intervención, los centros de la zona enviaron en promedio 38 534 muestras de carga vírica por trimestre. Este número aumentó en 130 346 muestras de VL, una subida de casi el 350 %. Antes de la intervención, los centros de nivel inferior estaban enviando a los centros 1517 muestras de VL por trimestre. Esta cifra aumentó bien por encima del 800 % a 13 958 muestras. Figura 6, tablas 1 y 2.
Fig. 6: Mejoras trimestrales en el procesamiento de muestras de carga vírica durante los 12 meses
****No está claro en el original pero lo he conservado. El uso aquí de la palabra centro se debe aclarar.
Muestra de pruebas trimestrales de VL en el centro
2 Muestra de pruebas trimestrales de VL en instalaciones de nivel inferior
3 Muestra de pruebas trimestrales de VL enviadas a los CPHL
Demonstrating How to Improve Operational Efficiency in Uganda’s Overall Pathology Service – Part 3
Ibrahimm Mugerwa1, Tony Boova2, Van Der Westhuizen2, Christopher Okiira1, Agnes Nakakawa3, Micheal Kasusse3, Suzan Nabadda1, Gaspard Guma1, Suleiman Ikoba1, Charles Kiyaga4
1Uganda National Health Laboratory Services, 2Beckman Coulter Life Sciences, 3Makerere University, 4ASLM
Greater efficiency for lab inventory management
The initial assessment found that supplies would be delayed, with frequent stock outs, due to poor communication because there was no clear chain of command for coordinating this activity. This was especially problematic for viral load and early infant diagnosis supplies (EID).
Ordering of supplies was found to be erratic, with no account being taken of the distribution cycles of the National Medical Stores (Uganda’s procurement agency). Further, there were no standardized tools and mechanisms for managing stock levels for Vital, Essential and Necessary (VEN) laboratory commodities.
To resolve this, CPHL worked with the new regional hubs coordinator to set up a centrally coordinated mechanism for distribution of viral load and EID supplies via the hub system. This led to a marked increase in the number of samples referred from the hubs to CPHL. Further, an exchange service was implemented between labs for buffer stock and other commodities.
Time management skills’ training was initiated for regionally-based staff so that they understood how to coordinate ordering with the centralized system run by the National Medical Stores. Towards the end of the pilot study, improvements were also noted in the transportation of supplies from central supply depots to hubs (via a CPHL centrally managed courier service) and their subsequent distribution to lower level facilities.
Improved workflow and reduced turnaround times
The Ugandan regional hub system defines turnaround time (TAT) in two ways:
- TAT1 –samples from lower health facilities to the hub: from the time the sample is dispatched to the result being generated by the hub.
- TAT2 –samples sent by the hub to CPHL the subsequent return of the result.
In the three months before the study started, TAT1 was averaging 2.7 weeks while TAT2 was around 4.3 weeks (see full TAT data for the eight hubs in Appendix 4). In addition, some results were misplaced due to the lack of adequate documentation and tracking system. Improvements were almost immediate, and by the end of the pilot, TAT1 and TAT2 were down to one week or less (Figure 3).
Figure 3: Significant reductions in both TAT1 and TAT 2 during the 12 month pilot study
Kiyaga C, Lee HH, Allain JP (2015) Adherence to Early Infant Diagnosis Testing Algorithm, a Challenge to Early Infant Diagnosis Program in Resource Limited Settings of Uganda. J HIV Clin Scientific Res 2(2): 030-039

A specific objective was to increase patient access to essential diagnostics for HIV/AIDS and opportunistic infections in the West Nile Health Region. The low volume of tests being carried out was a major factor in the lack of patient access.
Overall, sample volumes went up more than 350% in the 12 month pilot study (Figure 4). Complete blood counts went up 5% between the first and second quarter of the intervention.
Between the second and third quarter of the pilot study, the number of CBCs increased by 585. The slight dip (Figure 5) in quarter three is accounted for by normal migration patterns during festival time. Between the first and fourth quarters, increases in the volume of hematology specimens processed at the hub went up by almost 60% (Figure 5). For improvements in CD4 and GenXpert volumes see Figure 5a.
Figure 4: Overall Sample Volume Increases

Figure 5: Overall increases for CBC sample volumes

Figure 5a: Overall increases for sample volumes including CD4 and GenXpert

Before intervention, the hubs in the area averagely sent 38,534 viral load samples per quarter. This increased by 130,346 VL samples, an almost 350% rise. Before the intervention, lower sites were sending the hubs 1,517 VL samples each quarter. This increased well over 800% to 13,958 samples. Figure 6, charts 1 and 2.
Figure 6: Quarterly viral load sample processing improvements over the 12 months

Showing quarterly VL tests at the Hub

Showing quarterly VL tests at the lower facilities

Showing quarterly VL tests sent to CPHL
Fill the form to download Full case study

CD4 Testing in Remote Areas

CD4 testing in remote areas
Follow the links, to learn how Uganda designed an innovative system to ensure that people in remote communities can receive high quality HIV prevention, care and treatment services.
How Uganda is Leaving No One Behind
Around 1,350,000 people are currently living with HIV in Uganda, and there are an estimated 33 new HIV infections per day among young people between the ages of 15 and 24.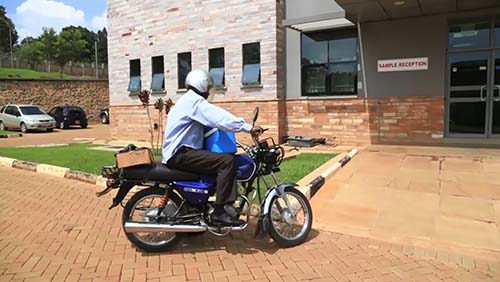
Efficient Sample Collection in Remote Areas
The main challenge faced by people in remote areas when it comes to HIV/AIDS testing is access. People in remote areas can be very poor, so it can be difficult for them to travel to the service point, although the treatment itself is free in Uganda.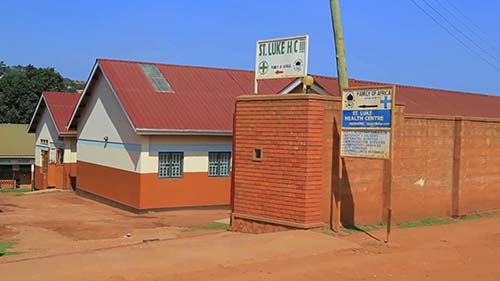
High Quality Testing in Rural Communities
The majority of countries still don’t have the infrastructure, transport or technology to effectively manage the collection, storage and transportation of the blood once the sample has been taken.
Demonstrating Operational Efficiencies: Part 1
Stimulating efficiency while empowering and mentoring local laboratory professionals in workflow management underpins the remarkable improvement in the routine laboratory service of Uganda’s West Nile Health Region.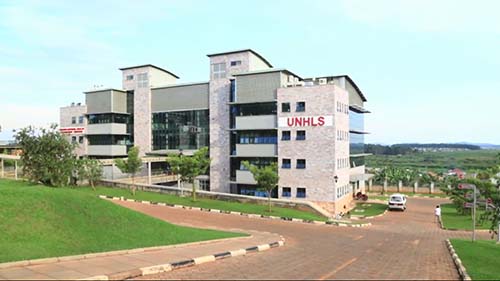
Demonstrating Operational Efficiencies: Part 2
Uganda’s Central Public Health Laboratories (CPHL) recognized that its regional laboratory service was suffering from a number of challenges that were affecting service delivery and patient outcomes.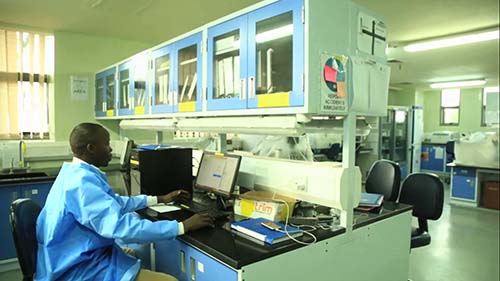
Demonstrating Operational Efficiencies: Part 3
The initial assessment found that supplies would be delayed, with frequent stock outs, due to poor communication because there was no clear chain of command for coordinating this activity.